How to use Excel's SUMIFS Function
Published by Myles Arnott
Oct 22, 2021 12:26:00 PM
Sum rows that meet specifc criteria
What does Excel's SUMIFS function do?
The SUMIFS function is one of Excel's maths and trig functions.
The SUMIFS function returns the total value for rows in a dataset that meet the criteria that have been defined.
SUMIFS is an extremely useful function for obtaining the values to use in your reports.
Here's a simple example
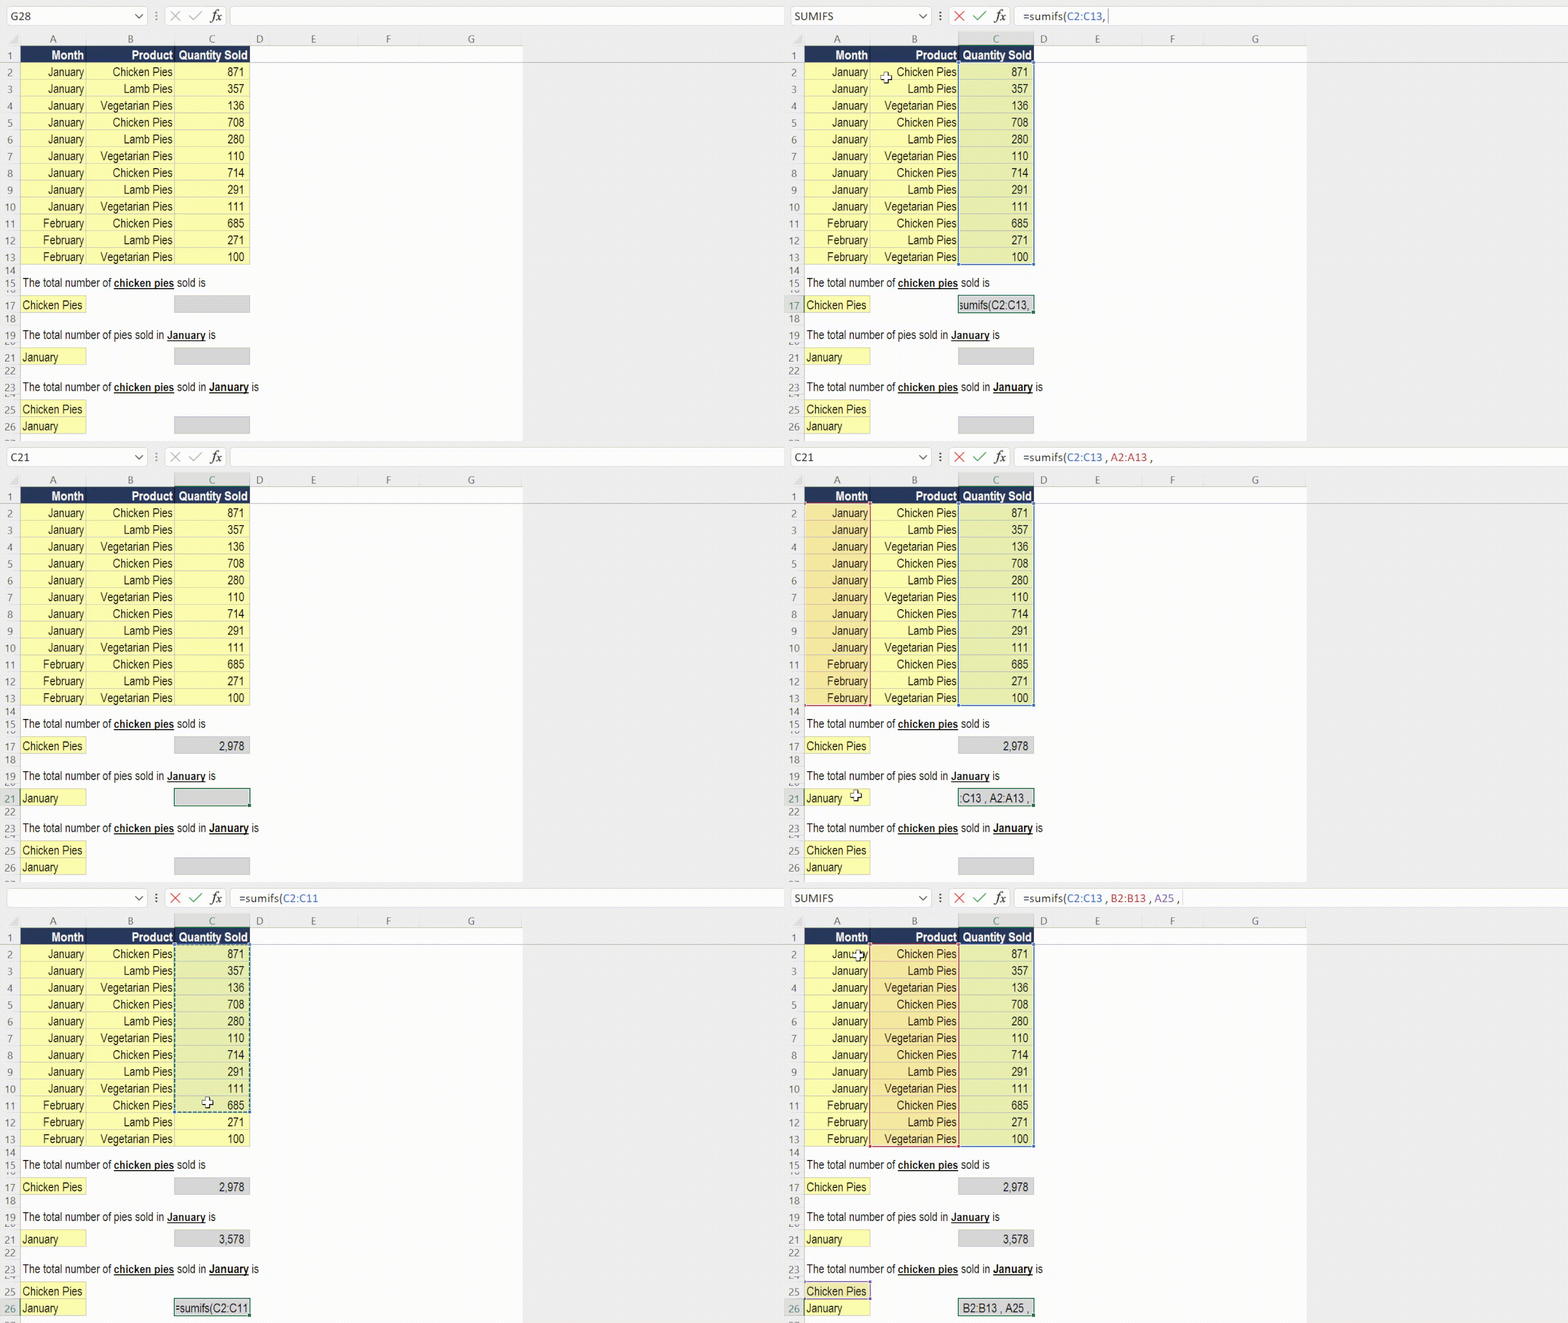
Let's take a look at a simple example of the SUMIFS function.
We would like to sum up the total quanity sold for three different sets of criteria:

What does that mean in plain English?
- Sum up the quantity sold for any row that has “Chicken Pies” in the product range.
- Sum up the quantity sold for any row that has “January” in the month range.
- Sum up the quantity sold for any row that has “Chicken Pies” in the product range and has “January” in the month range.
How do I write a formula using the SUMIFS function?
=SUMIFS(sum range, criteria range 1, criteria 1, criteria range 2, criteria 2, ... )
- sum range – What to sum up.
- criteria range 1– The first range to look in.
- criteria 1 – What to look for in criteria range 1.
What to consider when using the SUMIFS function in your financial model
- You can specify up to 127 criteria pairs.
- The criteria range must contain the same number of rows as the sum range.
- Use absolute cell references if you plan to copy the formula to other cells.
- SUMIFS supports logical operators (>,<,<>,=) and wildcards (*,?).
- Consider using Pivot Tables if you are performing one-off analysis.
- There are also COUNTIFS, AVERAGEIFS, MAXIFS and MINIFS functions.
Read more about the SUMIFS function on the Microsoft support page here.


